Leveraging the metaverse as an immersive educational tool to illustrate the present-day effects of historical redlining in Alameda County.
Project Overview
How might we use the metaverse to advocate for tolerance and empathy, bringing a sense of peace to global communities?
Duration: 7 weeks, completed December 2023
Role: Creative Technologist, Designer, Developer
Tools: Unreal Engine 5, UE5 Blueprints, Blender, R Studio, Cesium
Focus: Empathy-Driven Storytelling, VR Design, and Technical Implementation in Unity
Featured: Audited CCA IxD Class "Advanced Studio: Design for Metaverse"
Featured: Empathy and Coexistence in the Metaverse

Conceptualization
I wanted to challenge what we typically think of when we hear the word metaverse: an alternate reality that's disconnects us from our real, physical world. I used the metaverse as an immersive educational tool o help users understand the modern day realities of historically redlined neighborhoods in Alameda County.
To foster empathy and action towards uplifting communities by using an immersive, first person perspective to humanize the experience of living with varying access to resources.
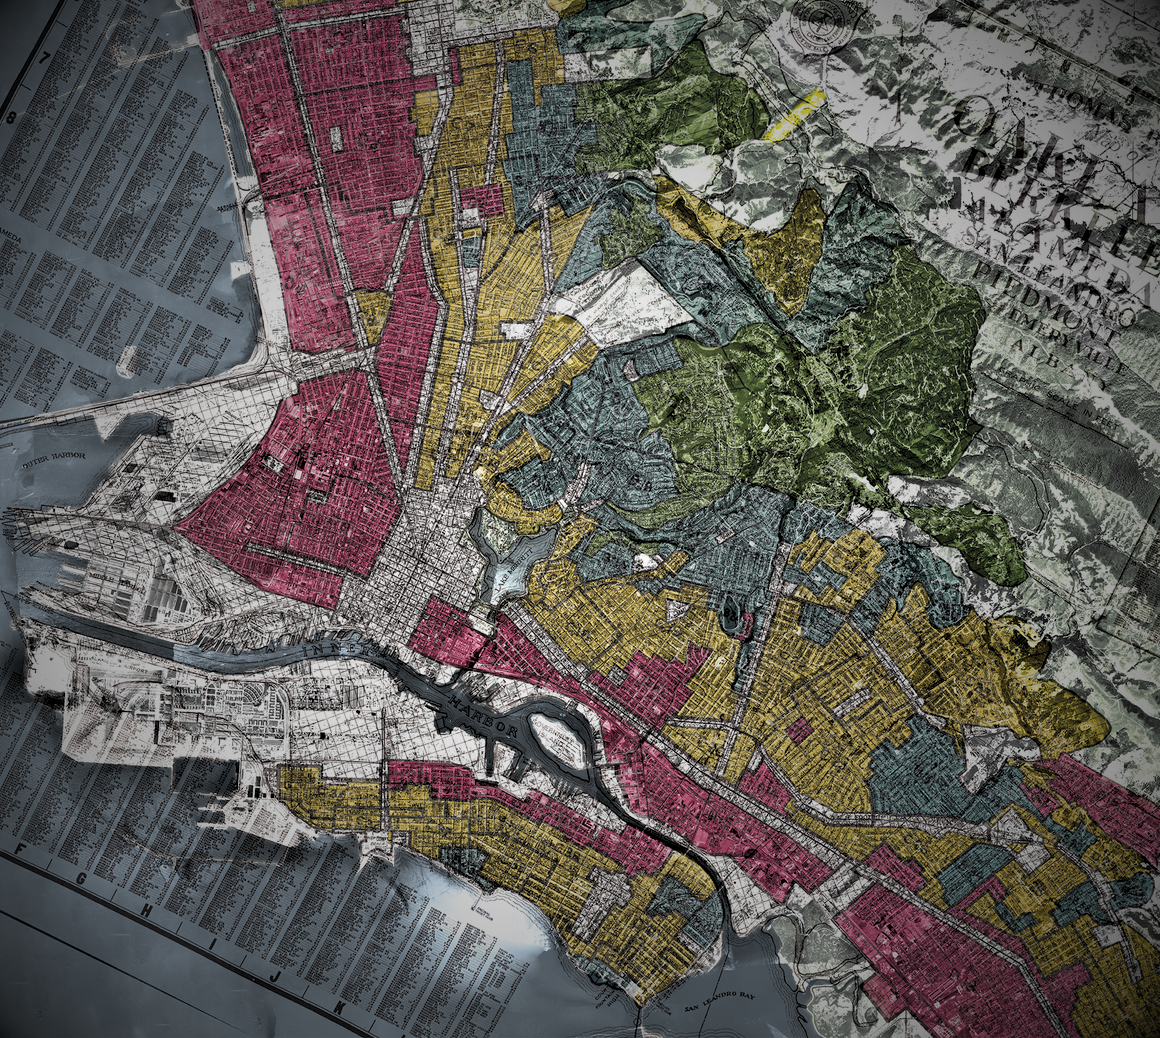
During the New Deal (1933 - 1938), Home Owners Loan Corporation created maps of “residential security”, determined by rates of “racial infiltration”. Maps determined who was eligible for New Deal's generously-subsidized, government-backed mortgages. “Desirable” and “Best” areas were outside of Oakland's city center, so the loss of urban population meant the loss of tax-base in cities, leading to fewer services and urban decay.
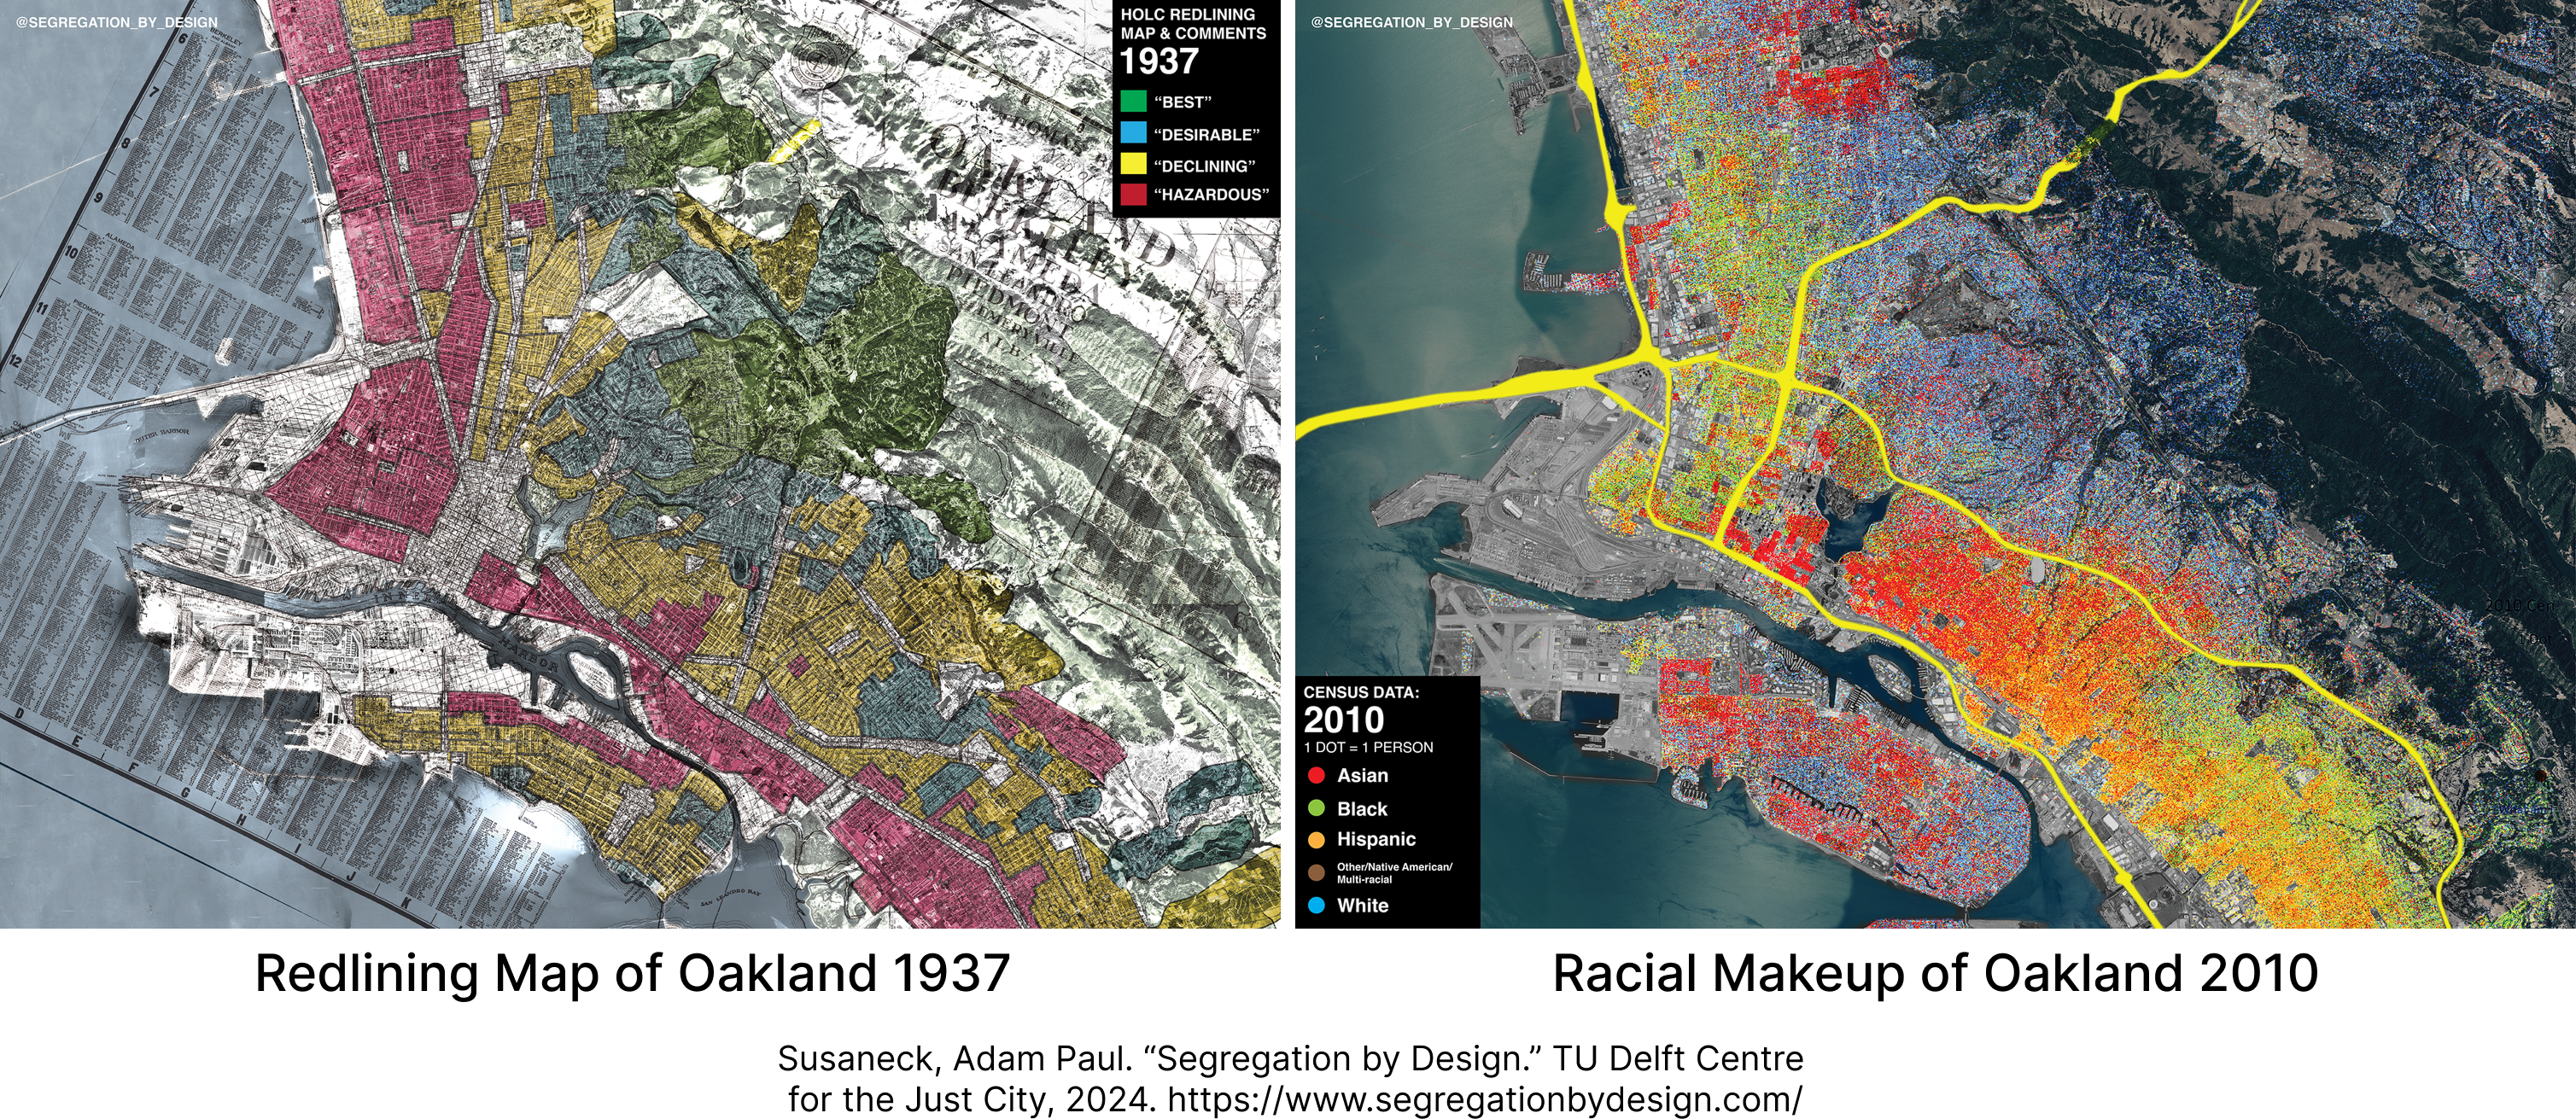
I researched how people have used census data to examine the current demography of neighborhoods, highlighting how racial segregation shaped modern day residential patterns.
Data, Design, & Development Process
Census Data Cleaning and Plotting in R
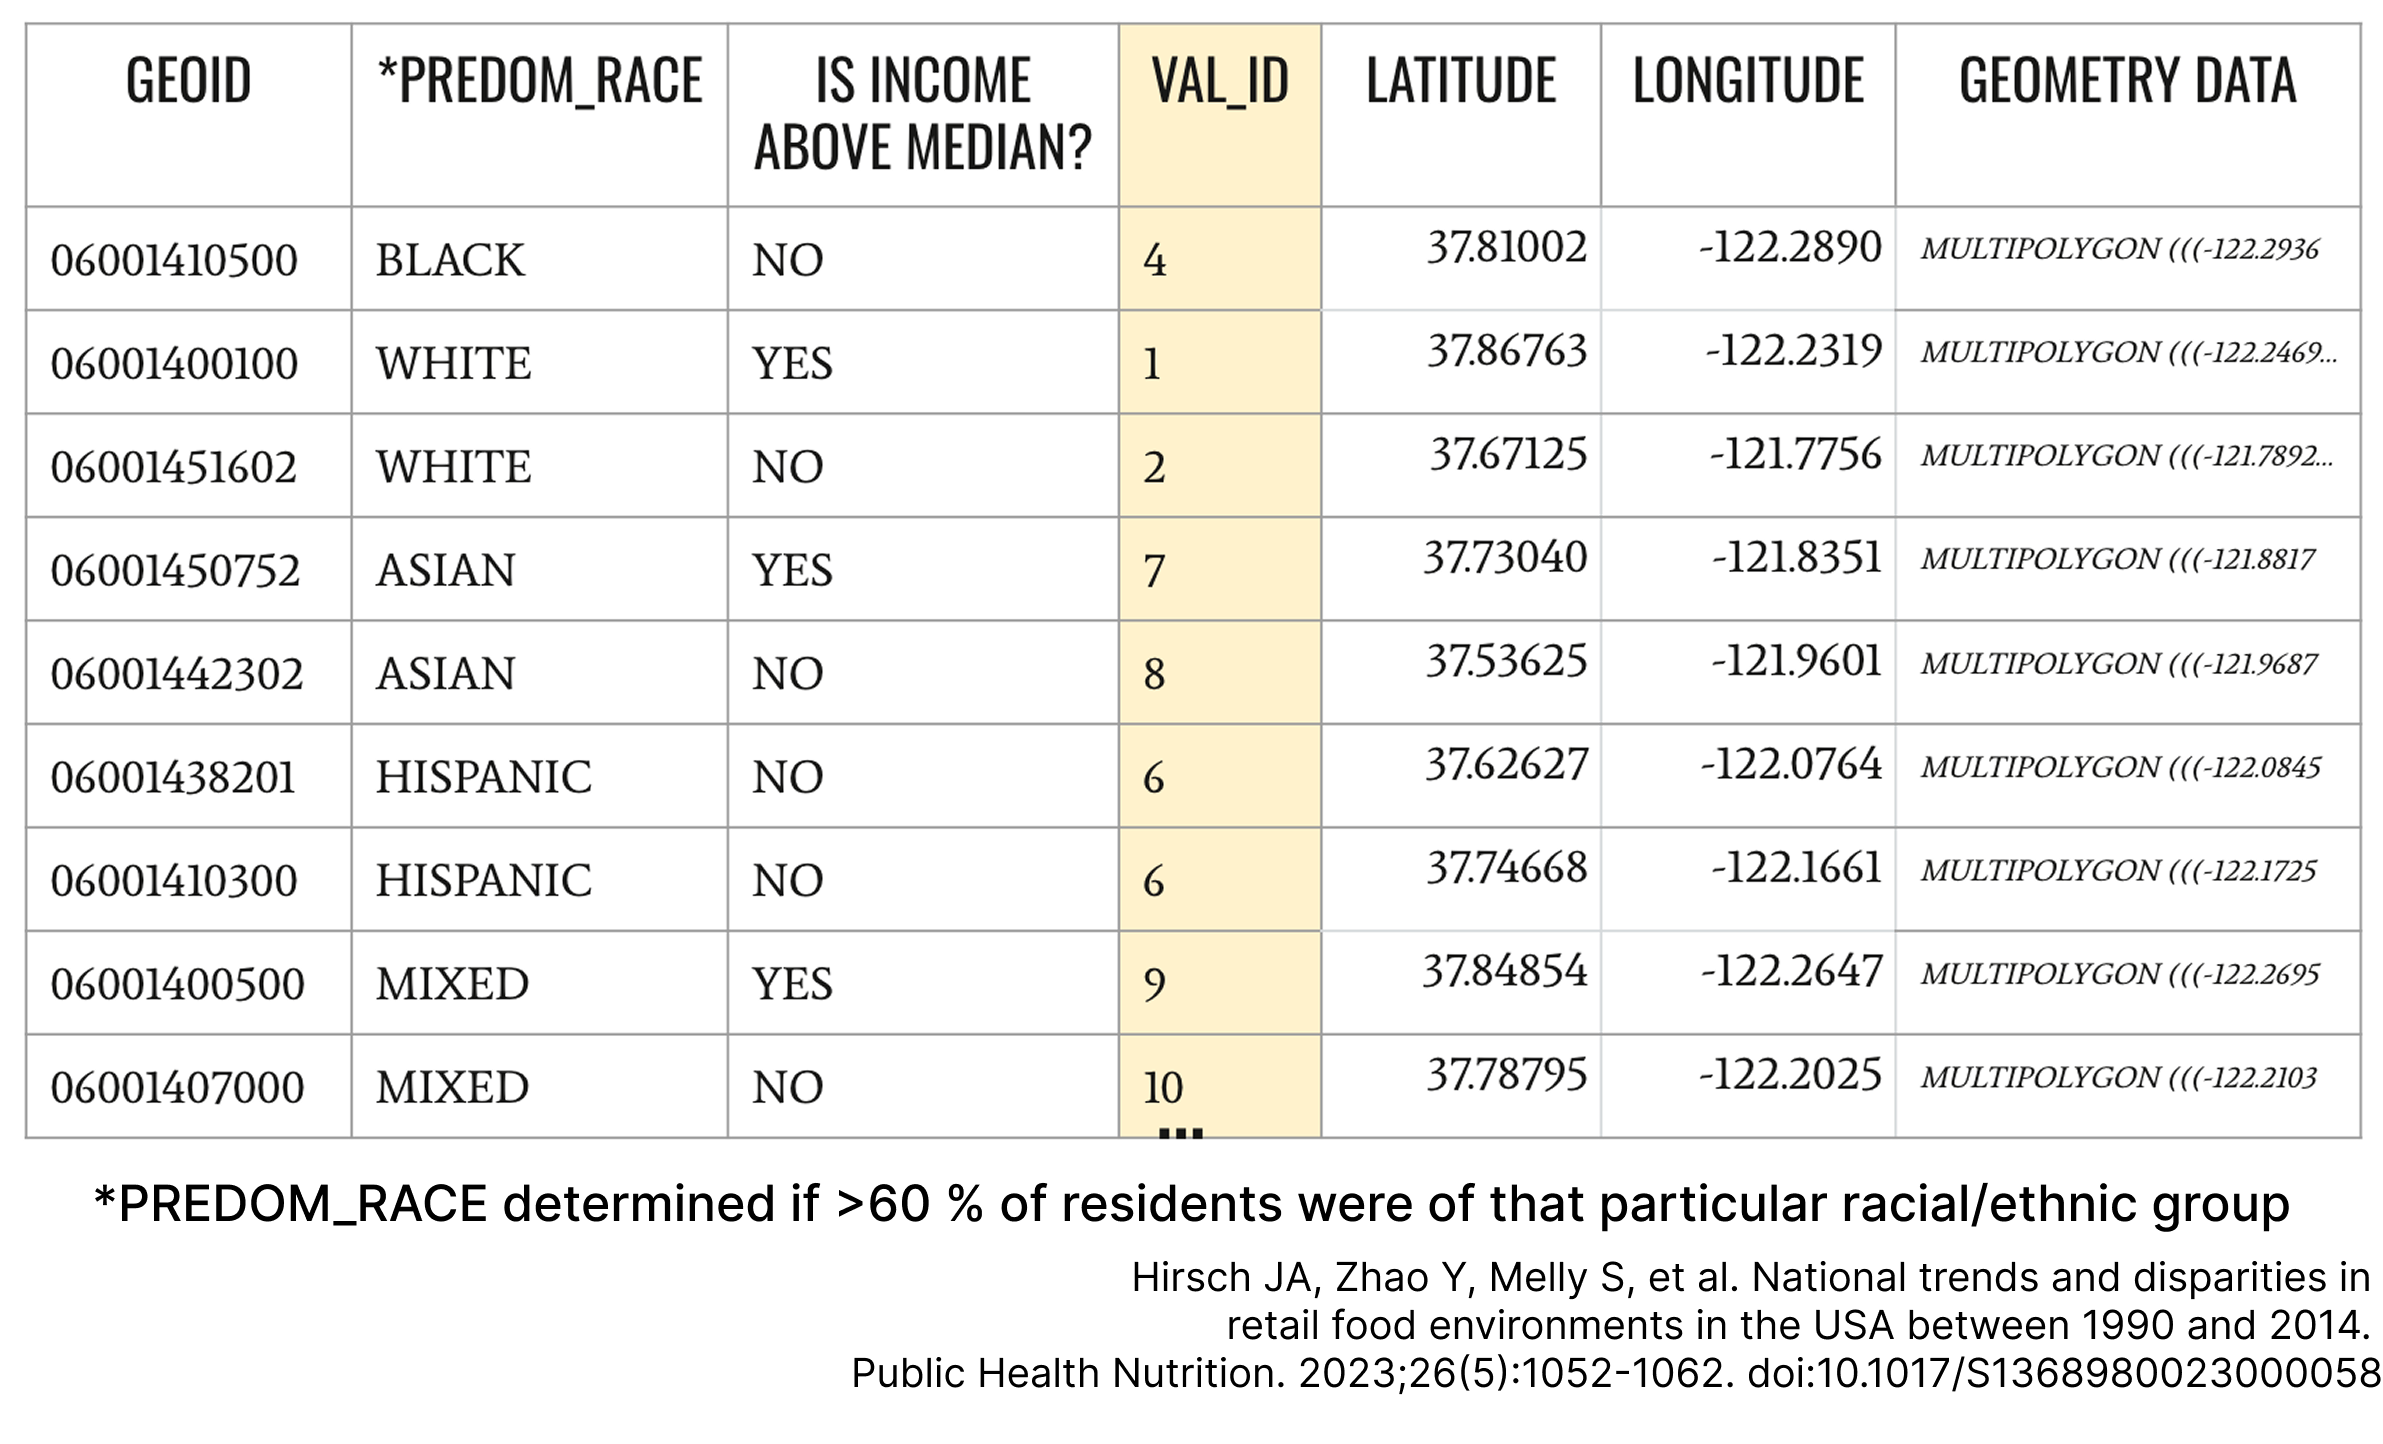
Using R, I extracted census tracts of Alameda county from 2015-2019 census data and merged them with the latitude and longitude values from a corresponding shape file. Next I created a new column for the predominat race of each census tract. This was determined determined if more than 60% of residents were of that particular racial/ethnic group (Hirsch et al., 2023). Each combonation of race + household income received a unique id, VAL_ID (ex: asian & income above 97309, VAL_ID = 7)
# create a predominant race column RACE_PREDOM
alamedaMerged$RACE_PREDOM <- apply(alamedaMerged[, c("RACE_BLACKNH", "RACE_HISP", "RACE_WHITENH", "RACE_ASIANNH","RACE_OTHERNH", "RACE_MULTIPLENH")], 1, function(row) {
  above60_columns <- names(row[row > 0.6])
  above60_columns_no_na <- na.omit(above60_columns)
  if (length(above60_columns_no_na) > 0) {
    above60_columns_no_na
  } else {
    "RACE_MIXED"
  }
})
# find median of INC_MEDHH
median_INC_MEDHH <- median(alamedaMerged$INC_MEDHH, na.rm = TRUE)
alamedaMerged$IS_INCOME_ABOVE_MEDIAN <- ifelse(alamedaMerged$INC_MEDHH > median_INC_MEDHH, 1, 0)

# assign val
alamedaMerged$VAL <- apply(alamedaMerged, 1, function(row) {
  switch(
    row$RACE_PREDOM,
    "RACE_WHITENH"= ifelse(row$IS_INCOME_ABOVE_MEDIAN, 1, 2),
    "RACE_BLACKNH"= 3,
    "RACE_HISP"= 4,
    "RACE_ASIANNH"= ifelse(row$IS_INCOME_ABOVE_MEDIAN, 5, 6),
    "RACE_MIXED"= ifelse(row$IS_INCOME_ABOVE_MEDIAN, 7, 8),
  )
})
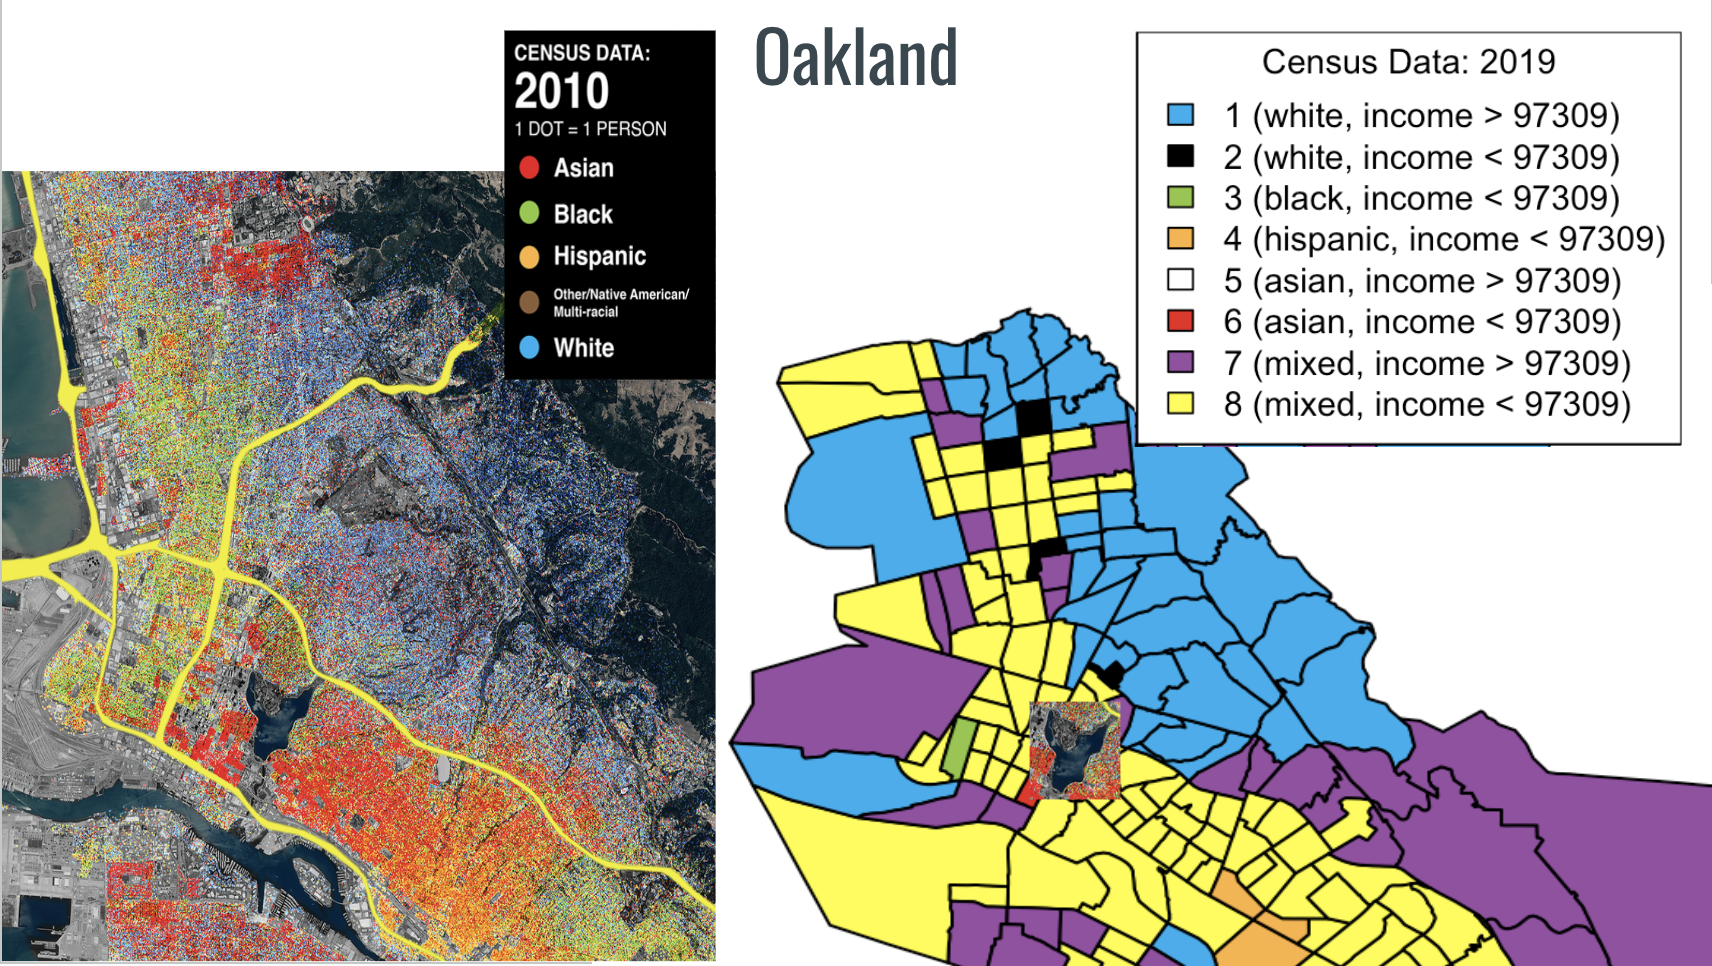
Each census tract was assigned a unique color corresponding to it's VAL_ID calculated from the previous code. I plotted the census tract boundaries on a map to visualize the predominat race and household income of each tract in Alameda County. I compared my map to the 2010 census data map of Oakland (Susaneck, 2024). The results were consistent.
# define colors
colors <- c(
  "VALUE_1" = "#00AFF0",  # white, income > 97309
  "VALUE_2" = "#FFFFFF",  # asian, income > 97309
  "VALUE_3" = "#984EA3",  # mixed, income > 97309
  "VALUE_4" = "#ED151E",  # asian, income < 97309FFFFFF
  "VALUE_5" = "#FFFF33",  # mixed, income < 97309
  "VALUE_6" = "#FCB23E",  # hispanic, income < 97309
  "VALUE_7" = "#000000",  # white, income < 97309
  "VALUE_8" = "#8DC73D"  # black, income < 97309
)

# map colors to data
color_mapping <- setNames(colors[unique(alamedaMerged$VAL)], unique(alamedaMerged$VAL))

print(color_mapping[4])

# assign colors and plot
alamedaMerged$SectionColors <- color_mapping[alamedaMerged$VAL]

plot(alamedaMerged$geometry, col = alamedaMerged$SectionColors)
3D Render of Oakland
I used Cesium Ion's UE5 Plugin with its PhotoRealistic 3D Tileset to render a realistic, immersive 3D model of Oakland. By leveraging Cesium's coordinate system and UE5's blueprints, I mapped the user to a census tract aligned with their selected race and income and spawned them in the neighborhood they would likely be living in. This lead to a stark contrast between a lush, green neighborhood with the sounds of birds chirping or houses next to noisy bart tracks and highways without a park in site.
Demo of a predominantly black, income below average neighborhood
Demo of a predominantly white, income above average neighborhood
User Interactions with Information Tokens
Interactive icons present facts about the neighborhood as well as highlighting the community efforts being made on the ground that's not always visible from top-down maps. Users learn about how neighborhoods were physically redlined by highways and bart tracks and the disruptive consequences they had on the community it torn through.
Demo of information tokens in a predominantly black, income below average neighborhood
Demo of information tokens in a predominantly white, income above average neighborhood
Final Experience
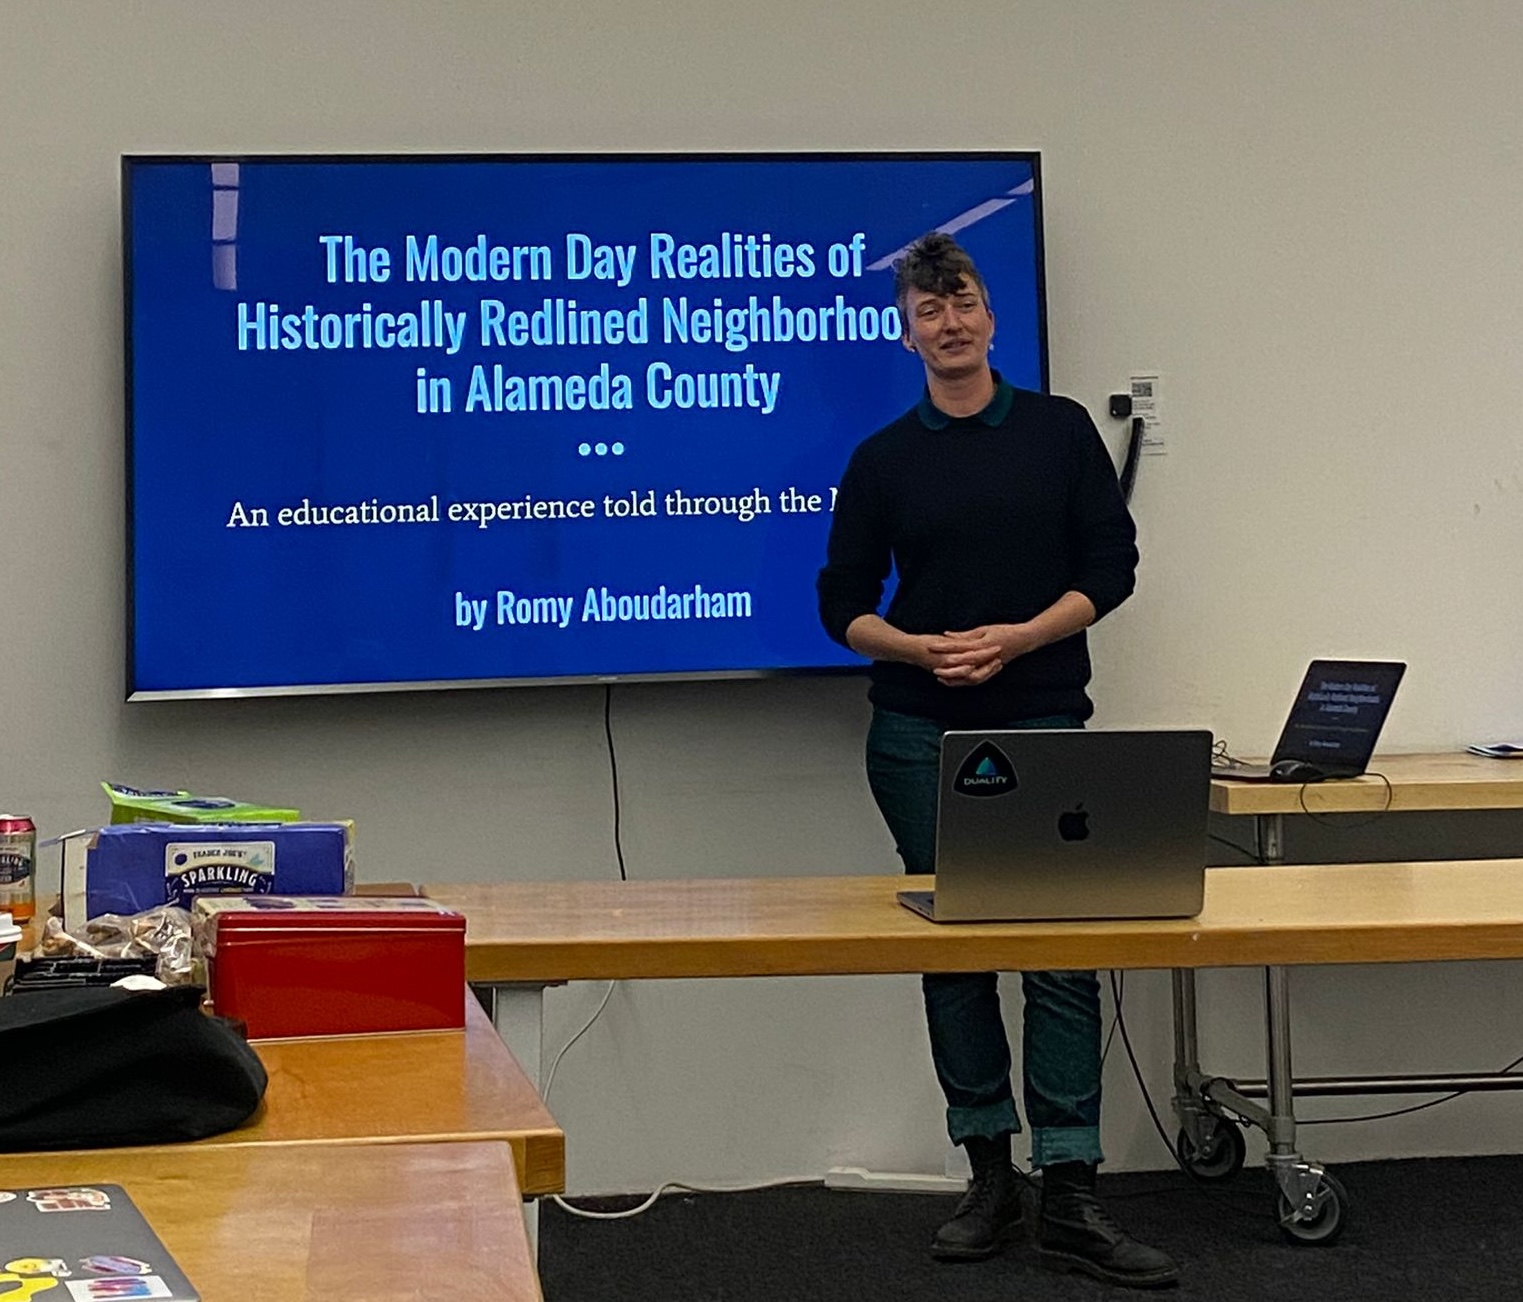
Me presenting my research, data, and demo for the class and guests. 2023